
ビックデータ、AI、ディープラーニングと騒がれて早数年
今後お仕事が無くなる恐怖と戦っている人もいるんじゃないかと思います。
私もそんな一人です。
■機械学習の色々
□機械学習全般
・線形回帰
・ロジスティック回帰
・単純パーセプトロン
・SVM(サポートベクターマシン)
・決定木
・ランダムフォレスト
・ナイーブベイズ(単純ベイズ)
・k近傍法
・K-means(K平均法)
等
□深層学習系(ディープラーニング)
・ニューラルネットワーク(NN,多層パーセプトロン)
・畳み込みニューラルネットワーク(CNN)
・再帰型ニューラルネットワーク(RNN)
・ディープボルツマンマシン
・積層自己符号化器
等
□強化学習
■用語
□教師あり学習、教師なし学習
□未学習、過学習
□バイアス、バリアンス
□目的関数、損失関数、誤差関数
□次元削減(次元の呪い)
□特徴量(数値、カテゴリ)
□訓練データ、テストデータ
□ハイパーパラメータ
□グリッドサーチ
□欠損値
■ライブラリ・フレームワーク
□scikit-learn(機械学習)
□TensorFlow(ディープラーニング)
□Chainer(ディープラーニング)
□Caffe(ディープラーニング)
□Theano(ディープラーニング)
ディープラーニングはGPU(CUDA)がハイスペックじゃないときついのでscikit-learnする
■環境
□anaconda
・scikit-learn
・numpy
・pandas
・jupyter (ipython)
・matplotlib
・seaborn
(その他必要に応じて)
■hello scikit-learn
とりあいずscikit-learnの公式からそのまんま実行
大体メジャーなやつが実行されてます。
[python]
import numpy as np
import matplotlib.pyplot as plt
from matplotlib.colors import ListedColormap
from sklearn.model_selection import train_test_split
from sklearn.preprocessing import StandardScaler
from sklearn.datasets import make_moons, make_circles, make_classification
from sklearn.neural_network import MLPClassifier
from sklearn.neighbors import KNeighborsClassifier
from sklearn.svm import SVC
from sklearn.gaussian_process import GaussianProcessClassifier
from sklearn.gaussian_process.kernels import RBF
from sklearn.tree import DecisionTreeClassifier
from sklearn.ensemble import RandomForestClassifier, AdaBoostClassifier
from sklearn.naive_bayes import GaussianNB
from sklearn.discriminant_analysis import QuadraticDiscriminantAnalysis
%matplotlib inline
h = .02 # step size in the mesh
names = ["Nearest Neighbors", "Linear SVM", "RBF SVM", "Gaussian Process",
"Decision Tree", "Random Forest", "Neural Net", "AdaBoost",
"Naive Bayes", "QDA"]
classifiers = [
KNeighborsClassifier(3),
SVC(kernel="linear", C=0.025),
SVC(gamma=2, C=1),
GaussianProcessClassifier(1.0 * RBF(1.0), warm_start=True),
DecisionTreeClassifier(max_depth=5),
RandomForestClassifier(max_depth=5, n_estimators=10, max_features=1),
MLPClassifier(alpha=1),
AdaBoostClassifier(),
GaussianNB(),
QuadraticDiscriminantAnalysis()]
X, y = make_classification(n_features=2, n_redundant=0, n_informative=2,
random_state=1, n_clusters_per_class=1)
rng = np.random.RandomState(2)
X += 2 * rng.uniform(size=X.shape)
linearly_separable = (X, y)
datasets = [make_moons(noise=0.3, random_state=0),
make_circles(noise=0.2, factor=0.5, random_state=1),
linearly_separable
]
figure = plt.figure(figsize=(27, 9))
i = 1
# iterate over datasets
for ds_cnt, ds in enumerate(datasets):
# preprocess dataset, split into training and test part
X, y = ds
X = StandardScaler().fit_transform(X)
X_train, X_test, y_train, y_test = \
train_test_split(X, y, test_size=.4, random_state=42)
x_min, x_max = X[:, 0].min() – .5, X[:, 0].max() + .5
y_min, y_max = X[:, 1].min() – .5, X[:, 1].max() + .5
xx, yy = np.meshgrid(np.arange(x_min, x_max, h),
np.arange(y_min, y_max, h))
# just plot the dataset first
cm = plt.cm.RdBu
cm_bright = ListedColormap([‘#FF0000’, ‘#0000FF’])
ax = plt.subplot(len(datasets), len(classifiers) + 1, i)
if ds_cnt == 0:
ax.set_title("Input data")
# Plot the training points
ax.scatter(X_train[:, 0], X_train[:, 1], c=y_train, cmap=cm_bright)
# and testing points
ax.scatter(X_test[:, 0], X_test[:, 1], c=y_test, cmap=cm_bright, alpha=0.6)
ax.set_xlim(xx.min(), xx.max())
ax.set_ylim(yy.min(), yy.max())
ax.set_xticks(())
ax.set_yticks(())
i += 1
# iterate over classifiers
for name, clf in zip(names, classifiers):
ax = plt.subplot(len(datasets), len(classifiers) + 1, i)
clf.fit(X_train, y_train)
score = clf.score(X_test, y_test)
# Plot the decision boundary. For that, we will assign a color to each
# point in the mesh [x_min, x_max]x[y_min, y_max].
if hasattr(clf, "decision_function"):
Z = clf.decision_function(np.c_[xx.ravel(), yy.ravel()])
else:
Z = clf.predict_proba(np.c_[xx.ravel(), yy.ravel()])[:, 1]
# Put the result into a color plot
Z = Z.reshape(xx.shape)
ax.contourf(xx, yy, Z, cmap=cm, alpha=.8)
# Plot also the training points
ax.scatter(X_train[:, 0], X_train[:, 1], c=y_train, cmap=cm_bright)
# and testing points
ax.scatter(X_test[:, 0], X_test[:, 1], c=y_test, cmap=cm_bright,
alpha=0.6)
ax.set_xlim(xx.min(), xx.max())
ax.set_ylim(yy.min(), yy.max())
ax.set_xticks(())
ax.set_yticks(())
if ds_cnt == 0:
ax.set_title(name)
ax.text(xx.max() – .3, yy.min() + .3, (‘%.2f’ % score).lstrip(‘0′),
size=15, horizontalalignment=’right’)
i += 1
plt.tight_layout()
plt.show()
[/python]
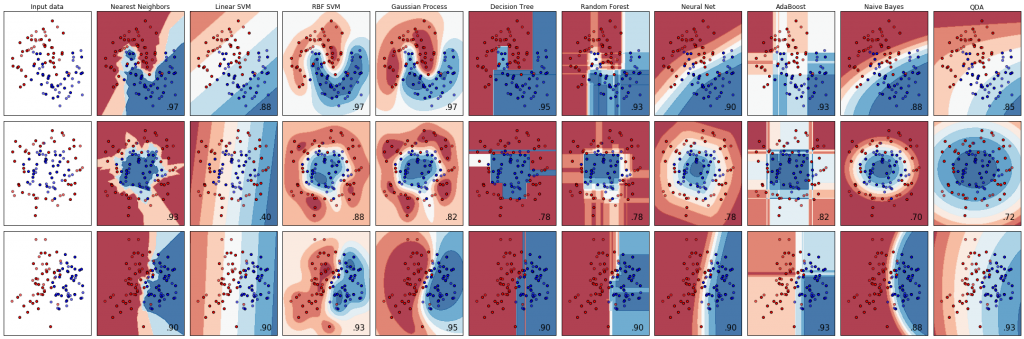
とりあいずこれで動作確認OK
ダミーの点が大体全部7~9割くらいの正解率、正直数字が良いのかどうか分かんない。